

Usage
Open Settings → Usage. The date range picker in the header drives every chart on the page, with presets from the last 24 hours out to the last three years, plus year to date and a custom range.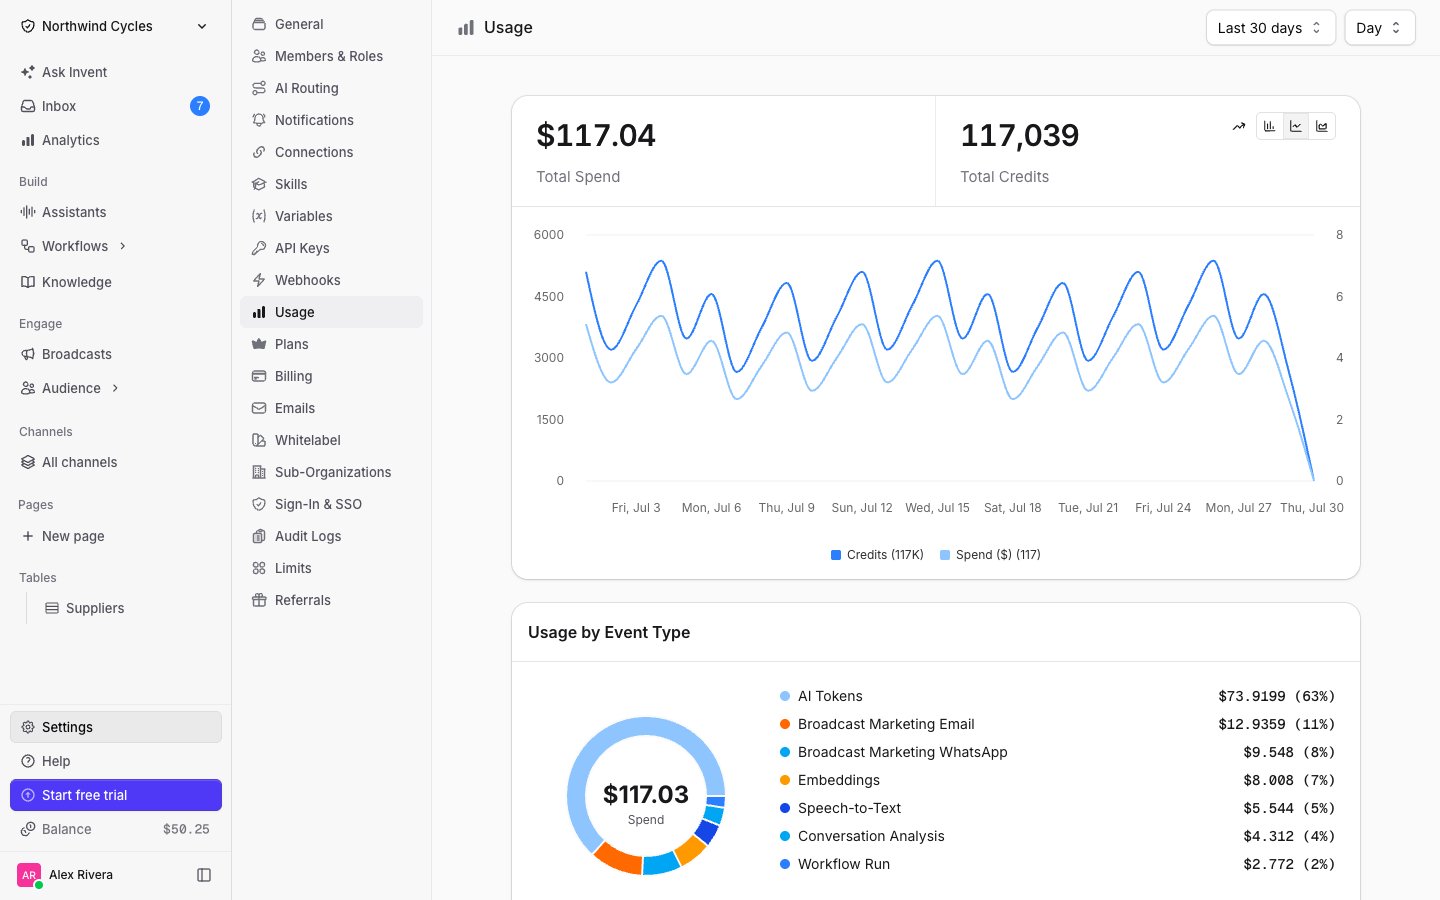
- Total Spend, in dollars.
- Total Credits, the internal unit every billable operation draws from. You pay in dollars; credits just let messages, knowledge searches and broadcast sends draw from one balance.
- A daily chart of both, so a spike is easy to spot. Use the controls in the corner to switch between bar, line and area, and to export the underlying numbers as CSV.
Where the money went
Usage by Event Type breaks the same range down by what produced the spend, with each type’s share of the total.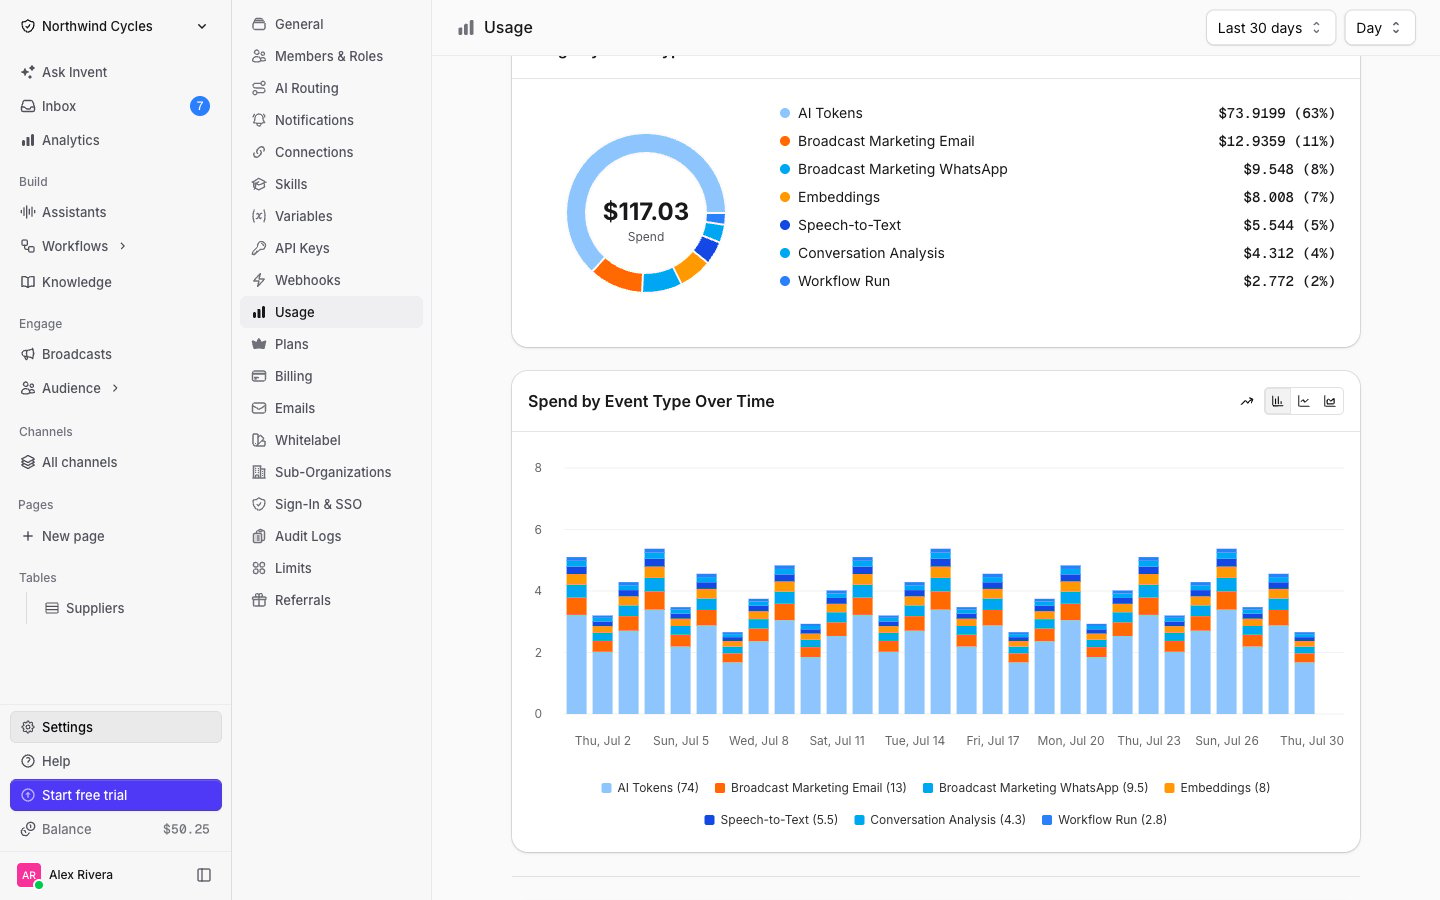
Spend by Event Type Over Time stacks the same categories per day, which is what you want when a total moved and you need to know which category moved with it.
Limits
Open Settings → Limits for the ceilings that come with your current plan.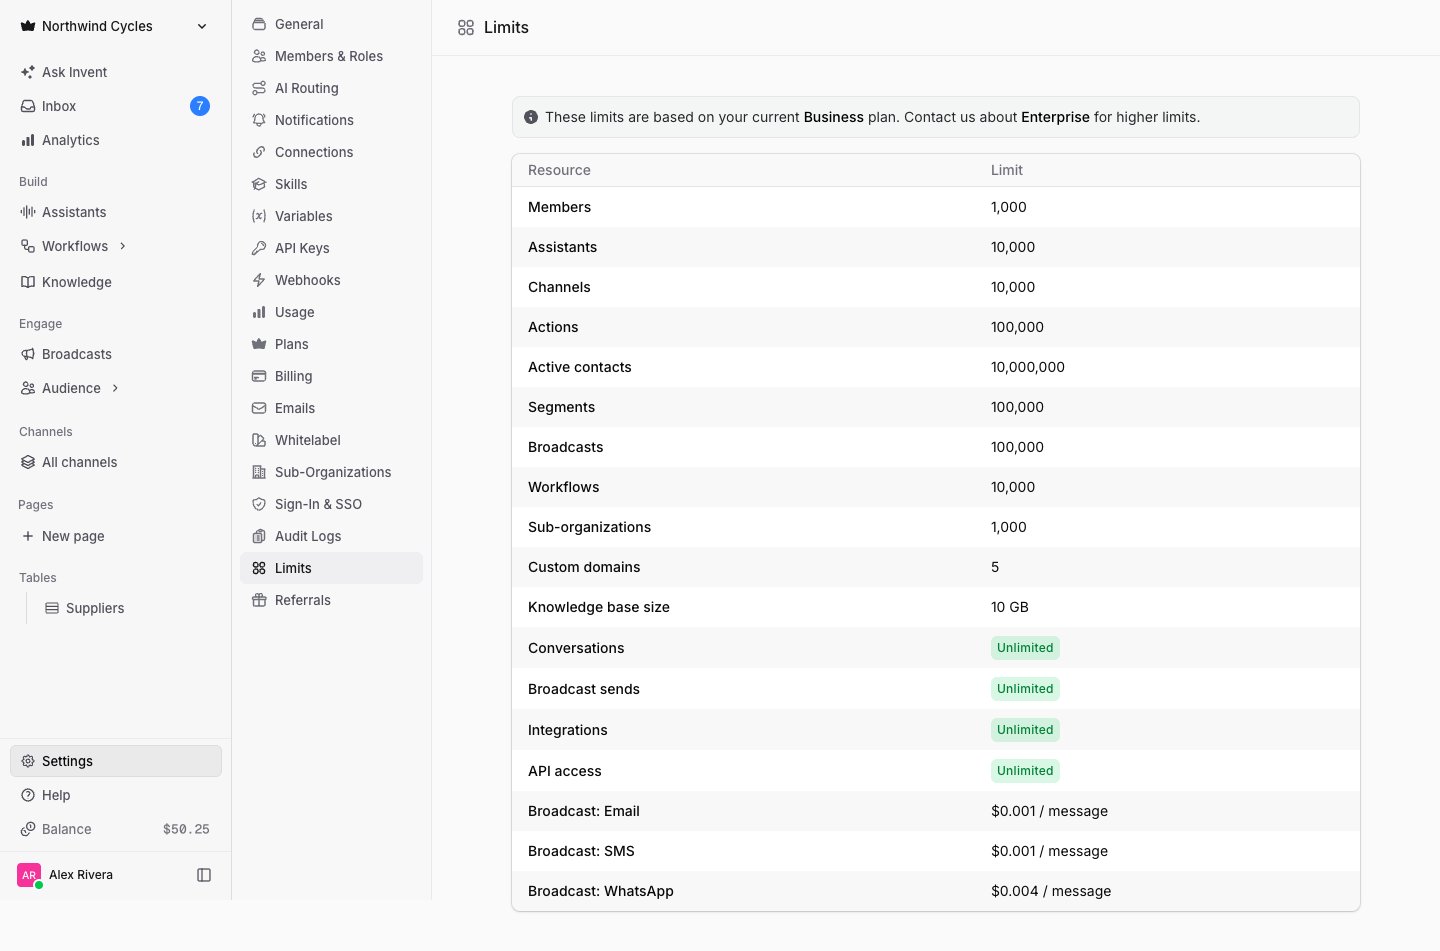
Limits follow your plan, so upgrading raises them immediately. If your workspace needs more than the listed ceilings, the banner at the top of the page points to Enterprise, where limits are set per workspace.
Keeping spend predictable
Usage and limits are only half the picture. The controls that actually cap what you can spend live in billing:- A monthly spending limit pauses billable operations once the cap is reached.
- Auto-recharge tops the balance up when it dips below a threshold, so sends do not stall.
Next Steps
Pricing and Plans
Rates, plans, spending limits and auto-recharge
Sub-Organizations
Track usage and caps per client or team